

Sri Lanka’s exports increased by 13-pct in January 2022
Sri Lanka’s merchandise exports increased by 13% to US$ 1,062.63 Million in January 2022 compared to January 2021 as per the data released by the Sri Lanka Customs. Further, it is a 5.7% increase when compared to January 2020.
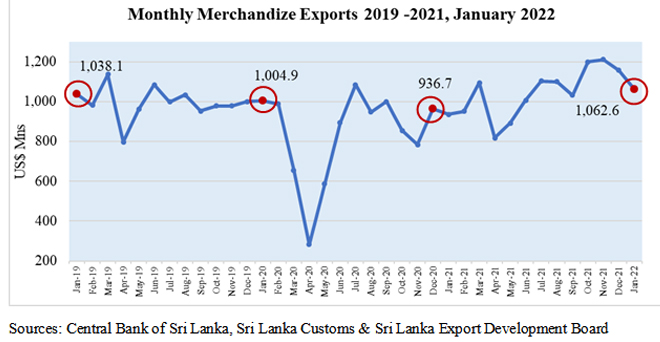
Table 1: Merchandise Export Performance
Values in US$ Mns
| Exports of Goods | Jan 2020 | Jan 2021 | Jan 2022 | % Growth (21-22) |
| Apparel & Textile | 472.07 | 421.28 | 514.41 | 22.11 |
| Tea | 99.73 | 100.99 | 91.23 | -9.66 |
| Rubber-based | 72.89 | 84.16 | 87.1 | 3.49 |
| Coconut-based | 49.05 | 54.18 | 68.28 | 26.02 |
| Diamond, Gems & Jewelery | 28.20 | 28.94 | 25.08 | -13.34 |
| Electronics & Electronic Components | 28.23 | 31.85 | 35.87 | 12.62 |
| Spices and Concentrates | 19.54 | 42.22 | 34.97 | -17.17 |
| Processed Food & Beverages | 27.01 | 31.35 | 30.74 | -1.95 |
| Seafood | 23.66 | 16.90 | 24.11 | 42.66 |
| Ornamental Fish | 1.45 | 0.88 | 1.78 | 102.27 |
| Vegetables | 2.63 | 1.70 | 2.36 | 38.82 |
| Fruits | 3.84 | 2.86 | 3.15 | 10.14 |
| Other Export Crops | 8.19 | 2.47 | 5.34 | 116.19 |
| Flowers & Foliage | 1.05 | 1.09 | 1.22 | 11.93 |
| Boat Building | 0.40 | 0.05 | 0.17 | 240.00 |
| Petroleum Products | 35.64 | 0.46 | 34.02 | 7295.65 |
| Others | 131.32 | 115.32 | 102.80 | -10.86 |
| Total Merchandize Exports | 1,004.9 | 936.70 | 1,062.63 | 13.44 |
Table 2: Top 10 Export Destinations
Values in US$ Mns
| Country | Jan 2020 | Jan 2021 | Jan 2022 | % Growth (21-22) | |
| 1 | United States | 267.61 | 233.53 | 295.25 | 26.43 |
| 2 | United Kingdom | 85.31 | 61.49 | 81.16 | 31.99 |
| 3 | India | 63.21 | 55.65 | 71.72 | 28.88 |
| 4 | Germany | 51.89 | 53.45 | 60.20 | 12.63 |
| 5 | Italy | 45.46 | 53.04 | 49.69 | -6.32 |
| 6 | Belgium | 29.61 | 23.70 | 24.78 | 4.56 |
| 7 | Netherlands | 22.71 | 34.86 | 38.68 | 10.96 |
| 8 | Canada | 17.07 | 23.83 | 29.82 | 25.14 |
| 9 | China | 19.25 | 21.98 | 18.81 | -14.42 |
| 10 | UAE | 15.72 | 15.22 | 23.88 | 56.90 |
| Others | 387.06 | 359.95 | 368.64 | 2.41 | |
| Total | 1,004.90 | 936.70 | 1,062.63 | 13.44 |
Exports to FTA Partners
During the month of January 2022, exports to Free Trade Agreement (FTA) partners accounted for 7.2% of total merchandise exports increased by 28 % to US$ 80.31 Mn.
Moreover, Exports to India and Pakistan increased by 28.9% and 21% y-o-y to US$ 71.72 Mn and US$ 8.59 Mn respectively during the month of January 2022. Increased Exports to India is mainly supported by increased exports of Animal Feed (11%), Pepper (17.86%), Woven fabrics (26.5%) and Apparel (65.51%) in January 2022.
In addition, better performance recorded in Pakistan led by Desiccated Coconut, Other Articles of Stones, Woven Fabrics and Perfumes, Cosmetics, Shampoos & Makeup Preparations and Other Electrical & Electronic Products.
Table 3: Export Regions
Values in US$ Mns
| Region | Jan 2020 | Jan 2021 | Jan 2022 | % Growth (21-22) |
| European Union (EU) excluding UK | 212.7 | 204.03 | 206.74 | 1.33 |
| United States | 237.61 | 223.53 | 255.25 | 14.19 |
| South Asia | 100.02 | 61.58 | 112.86 | 83.27 |
| ASEAN | 43.11 | 63.71 | 69.90 | 9.72 |
| CIS Countries | 18.75 | 17.95 | 28.85 | 60.72 |
| African Countries | 26.66 | 19.63 | 24.56 | 25.11 |
| Middle East Countries (excl. Cyprus & Egypt) | 24.89 | 21.04 | 21.30 | 1.24 |
| Others | 255.85 | 325.23 | 343.17 | 5.52 |
| Total Merchandise Exports | 1,004.90 | 936.70 | 1,062.63 | 13.44 |
Export of Services
The estimated value of services exports for the month of January 2022 was 313.22 Million dollars, increasing 42.2 % over the corresponding month of 2021. The services exports estimated by EDB consists of ICT/BPM, Construction, Financial services and Transport & Logistics.